Monthly Analytics
The monthly analytics page shows revenue trends and student retention data for your studio on a month-by-month basis.
Go to Dashboard > Analytics > Monthly to access this page.
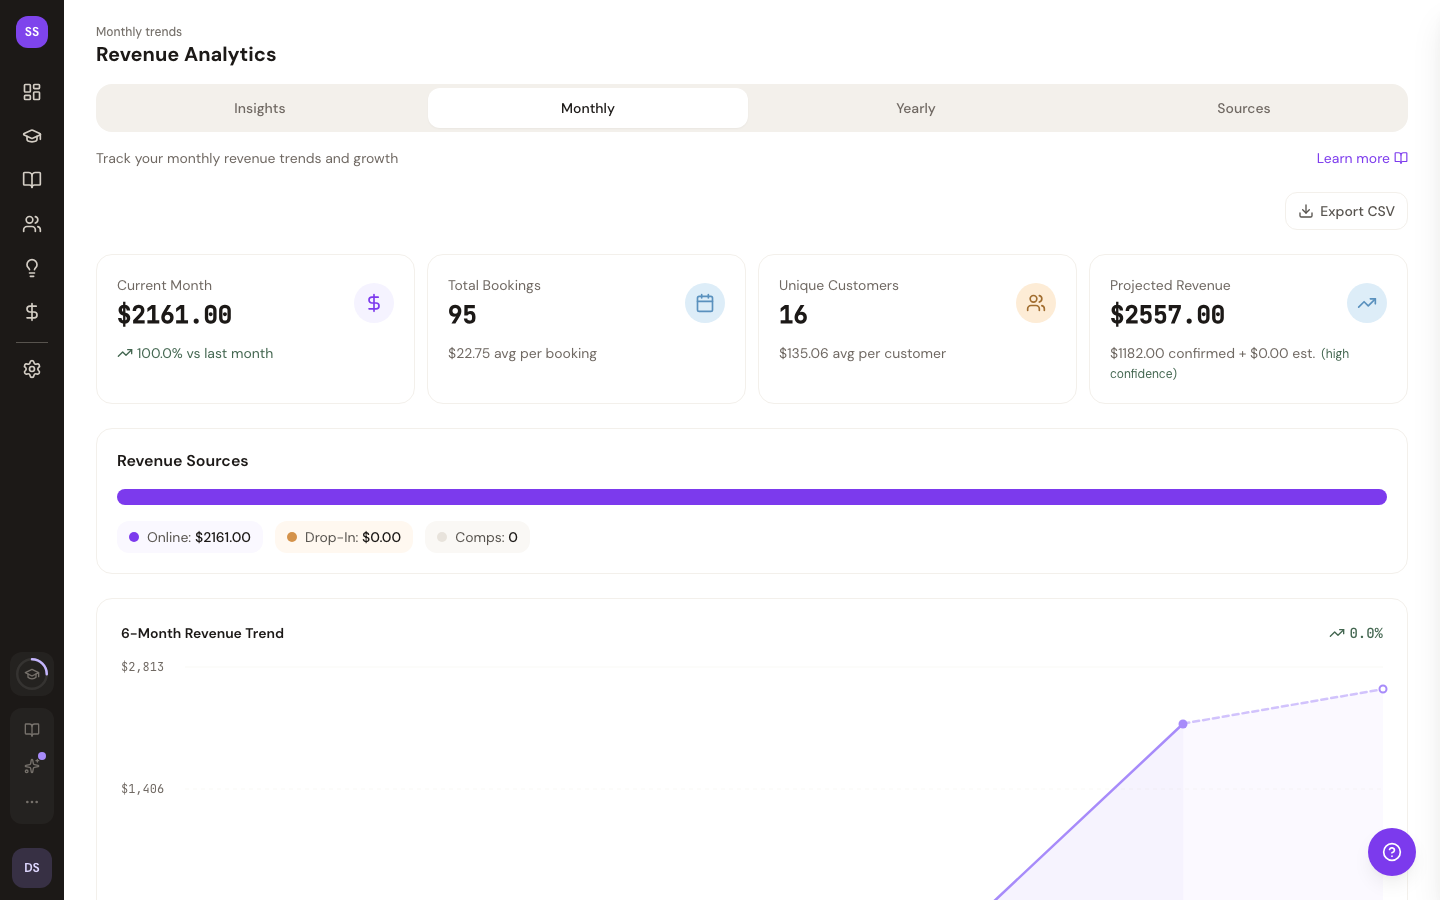
Revenue Trends
A visual chart displays your monthly revenue over time, helping you identify growth patterns, seasonal trends, and the impact of promotions or pricing changes.
Student Retention
A cohort retention table shows how well your studio retains students over time. Each row represents a cohort of students who first booked in a given month, and the columns show what percentage returned in subsequent months.
This helps you understand:
- How many first-time students come back
- Whether retention is improving or declining over time
- Which months had the strongest initial engagement
Related Pages
- Yearly Analytics — view annual trends
- Traffic Sources — see where your bookings come from
- Viewing Analytics — general analytics overview
Need Help?
Contact support at support@studiobase.org if you have questions about your analytics.
Last updated March 16, 2026