Viewing Analytics
StudioBase provides monthly and yearly revenue analytics so you can track your studio's financial performance over time.
Navigating Analytics
From your Dashboard, use the tab bar at the top of the analytics section:
- Weekly — Opens the Insights dashboard
- Monthly — Monthly revenue trends and growth
- Yearly — Annual performance overview
Monthly Analytics
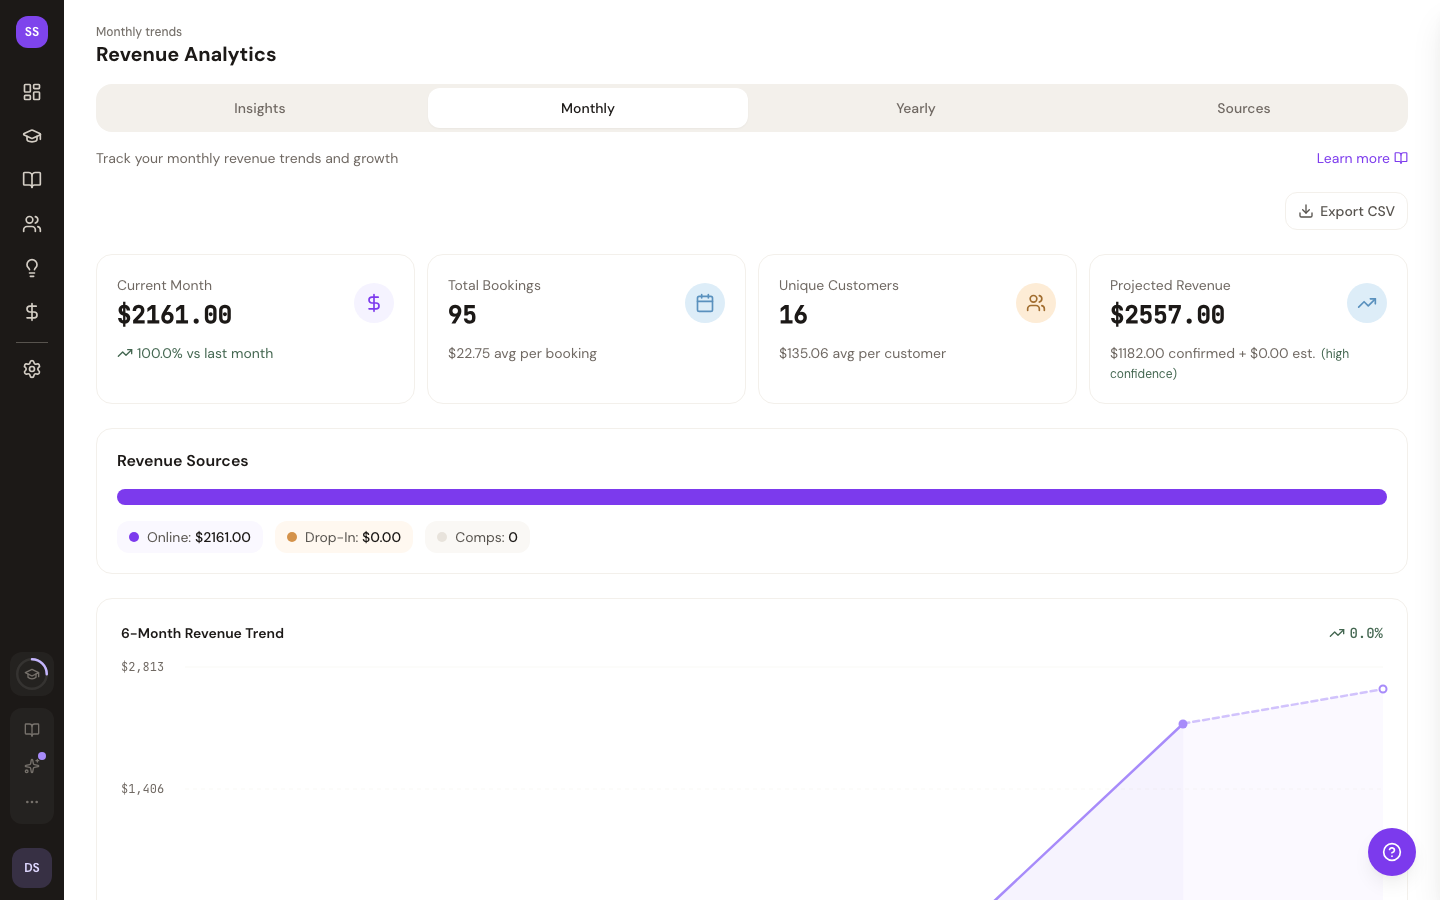
The Monthly view shows your revenue performance over the last 6 months.
Summary Cards
Three cards at the top give you a quick snapshot:
| Card | Shows |
|---|---|
| Current Month | Total revenue this month, with growth percentage vs. last month |
| Total Bookings | Number of bookings this month, plus average revenue per booking |
| Unique Customers | Customer count this month, plus average revenue per customer |
Growth is shown as a percentage — green with an up arrow for positive growth, red with a down arrow for decline.
6-Month Revenue Trend
A chart below the summary cards visualizes your revenue trend across the last 6 months, with an overall percentage change indicator.
Monthly Breakdown Table
A detailed table lists each of the last 6 months with:
- Month name
- Revenue total
- Growth percentage (vs. previous month)
- Bookings count
- Customers count
On smaller screens, some table columns are hidden to keep the layout readable. The most important columns (month and revenue) are always visible.
Yearly Analytics
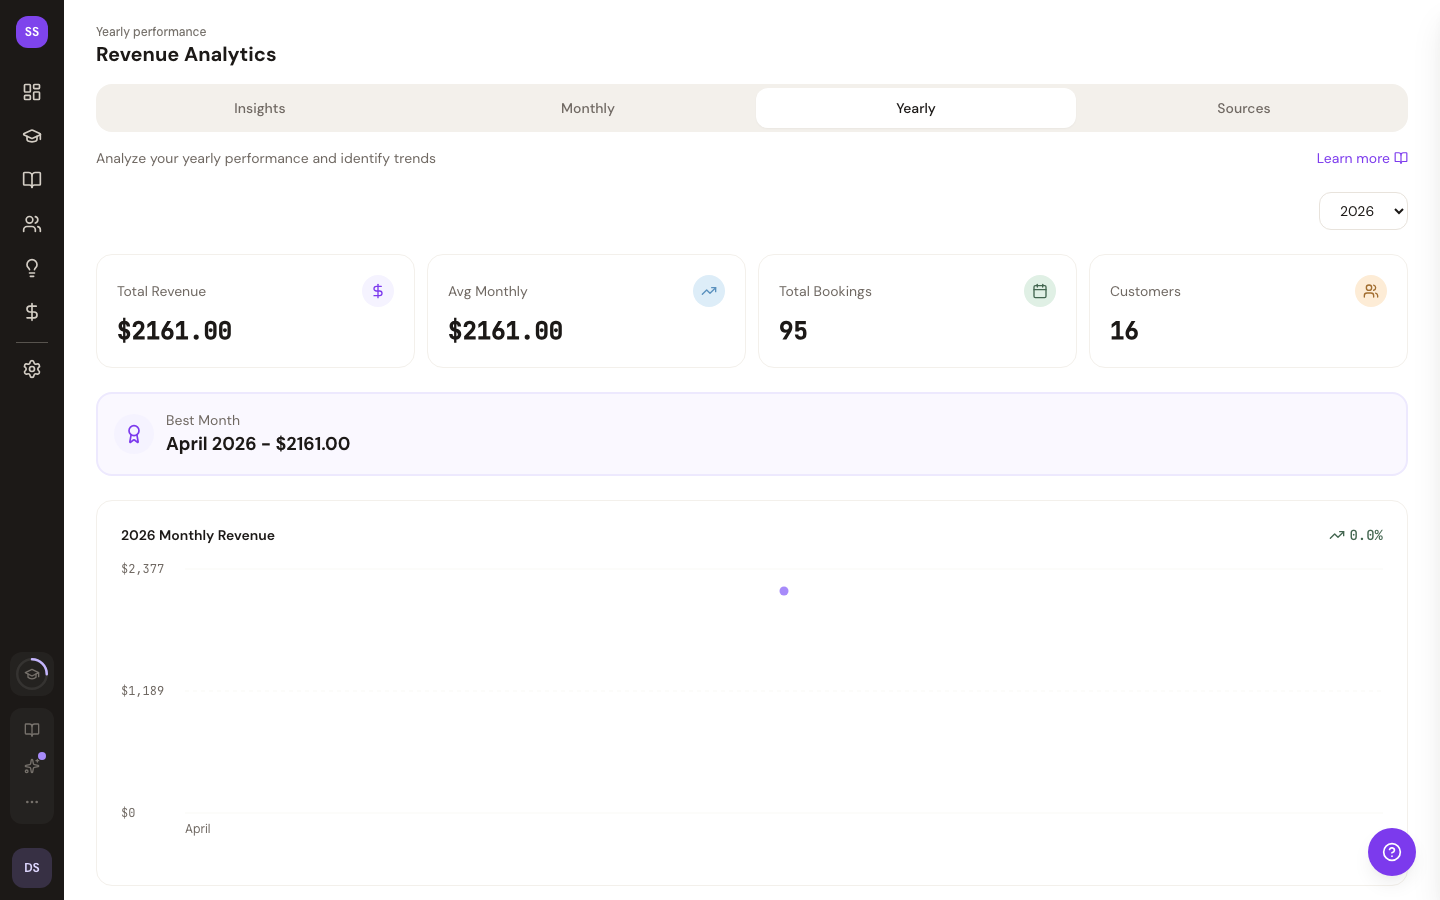
The Yearly view gives you a full-year overview of your studio's performance.
Selecting a Year
Use the year dropdown in the top-right corner to switch between the current year and up to 4 previous years.
Summary Cards
Four cards show annual totals:
| Card | Shows |
|---|---|
| Total Revenue | All revenue for the selected year |
| Avg Monthly | Average monthly revenue |
| Total Bookings | Total bookings for the year |
| Customers | Total unique customers for the year |
Best Month
If the selected year has revenue data, a highlighted card shows your best-performing month with its name and revenue total.
Yearly Revenue Chart
A chart displays revenue for all 12 months of the selected year, making seasonal patterns easy to spot.
Monthly Breakdown Table
A full 12-month table shows:
- Month name
- Revenue total
- % of Total — how much of the year's revenue came from this month
- Bookings count
- Customers count
The best-performing month is highlighted in the table.
Data Freshness
- Current month/year data refreshes frequently (every few minutes)
- Past month/year data is cached longer since it doesn't change
Click anywhere on the analytics pages to see the most recent data. If you've just received a booking payment, it may take a moment to appear.
Need Help?
Contact support@studiobase.org for analytics questions.